


Primary Pollutant
Major Air Pollutants
Wind speed
33 km/h
UV Index
16
Pressure
800 mb
Air Pollution Graph
(last 48 hrs)


World Most Polluted CitiesLive Air Quality Ranking
Air Quality Index (AQI) depicts the extent of air pollution at a particular location. These are world rankings of cities and countries with the worst air quality in real-time. Find out whether your location is among the most polluted.
City Rankings
Country Rankings
1
2
3
4
5
6
7
8
9
10
11
12
13
14
15
16
17
18
19
20
21
22
23
24
25
26
27
28
29
30
31
32
33
34
35
36
37
38
39
40
41
42
43
44
45
46
47
48
49
50
411
![]() Follow
Follow
402
![]() Follow
Follow
390
![]() Follow
Follow
364
![]() Follow
Follow
360
![]() Follow
Follow
344
![]() Follow
Follow
338
![]() Follow
Follow
330
![]() Follow
Follow
325
![]() Follow
Follow
322
![]() Follow
Follow
322
![]() Follow
Follow
307
![]() Follow
Follow
298
![]() Follow
Follow
298
![]() Follow
Follow
278
![]() Follow
Follow
273
![]() Follow
Follow
270
![]() Follow
Follow
266
![]() Follow
Follow
264
![]() Follow
Follow
262
![]() Follow
Follow
261
![]() Follow
Follow
257
![]() Follow
Follow
229
![]() Follow
Follow
224
![]() Follow
Follow
223
![]() Follow
Follow
223
![]() Follow
Follow
217
![]() Follow
Follow
216
![]() Follow
Follow
213
![]() Follow
Follow
213
![]() Follow
Follow
210
![]() Follow
Follow
210
![]() Follow
Follow
209
![]() Follow
Follow
200
![]() Follow
Follow
199
![]() Follow
Follow
192
![]() Follow
Follow
190
![]() Follow
Follow
187
![]() Follow
Follow
187
![]() Follow
Follow
185
![]() Follow
Follow
185
![]() Follow
Follow
182
![]() Follow
Follow
182
![]() Follow
Follow
181
![]() Follow
Follow
181
![]() Follow
Follow
178
![]() Follow
Follow
175
![]() Follow
Follow
173
![]() Follow
Follow
171
![]() Follow
Follow
170
![]() Follow
Follow
Good
Moderate
Poor
Unhealthy
Severe
Hazardous
View Full Ranking
Real-time Air Quality Index (AQI) Live
Current air pollution level and weather condition of your location with the aggregate levels of major air pollutants in the ambient air.
Health Advice
Weather Forecast
| AQI | Station | PM 2.5 | PM 10 | SO2 | NO2 | O3 | CO | Updated |
|---|
Compare air pollution of vs
World Most Polluted Cities
Live Air Quality Ranking
Air Quality Index (AQI) depicts the extent of air pollution at a particular location. These are world rankings of cities and countries with the worst air quality in real-time. Find out whether your location is among the most polluted.
City Rankings
Country Rankings
1
2
3
4
5
6
7
8
9
10
11
12
13
14
15
16
17
18
19
20
21
22
23
24
25
26
27
28
29
30
31
32
33
34
35
36
37
38
39
40
41
42
43
44
45
46
47
48
49
50
411
![]() Follow
Follow
402
![]() Follow
Follow
390
![]() Follow
Follow
364
![]() Follow
Follow
360
![]() Follow
Follow
344
![]() Follow
Follow
338
![]() Follow
Follow
330
![]() Follow
Follow
325
![]() Follow
Follow
322
![]() Follow
Follow
322
![]() Follow
Follow
307
![]() Follow
Follow
298
![]() Follow
Follow
298
![]() Follow
Follow
278
![]() Follow
Follow
273
![]() Follow
Follow
270
![]() Follow
Follow
266
![]() Follow
Follow
264
![]() Follow
Follow
262
![]() Follow
Follow
261
![]() Follow
Follow
257
![]() Follow
Follow
229
![]() Follow
Follow
224
![]() Follow
Follow
223
![]() Follow
Follow
223
![]() Follow
Follow
217
![]() Follow
Follow
216
![]() Follow
Follow
213
![]() Follow
Follow
213
![]() Follow
Follow
210
![]() Follow
Follow
210
![]() Follow
Follow
209
![]() Follow
Follow
200
![]() Follow
Follow
199
![]() Follow
Follow
192
![]() Follow
Follow
190
![]() Follow
Follow
187
![]() Follow
Follow
187
![]() Follow
Follow
185
![]() Follow
Follow
185
![]() Follow
Follow
182
![]() Follow
Follow
182
![]() Follow
Follow
181
![]() Follow
Follow
181
![]() Follow
Follow
178
![]() Follow
Follow
175
![]() Follow
Follow
173
![]() Follow
Follow
171
![]() Follow
Follow
170
![]() Follow
Follow
Good
Moderate
Poor
Unhealthy
Severe
Hazardous
View Full Ranking
Total number of Good & Bad air quality days in last days at
Good
Moderate
Poor
Unhealthy
Severe
Hazardous
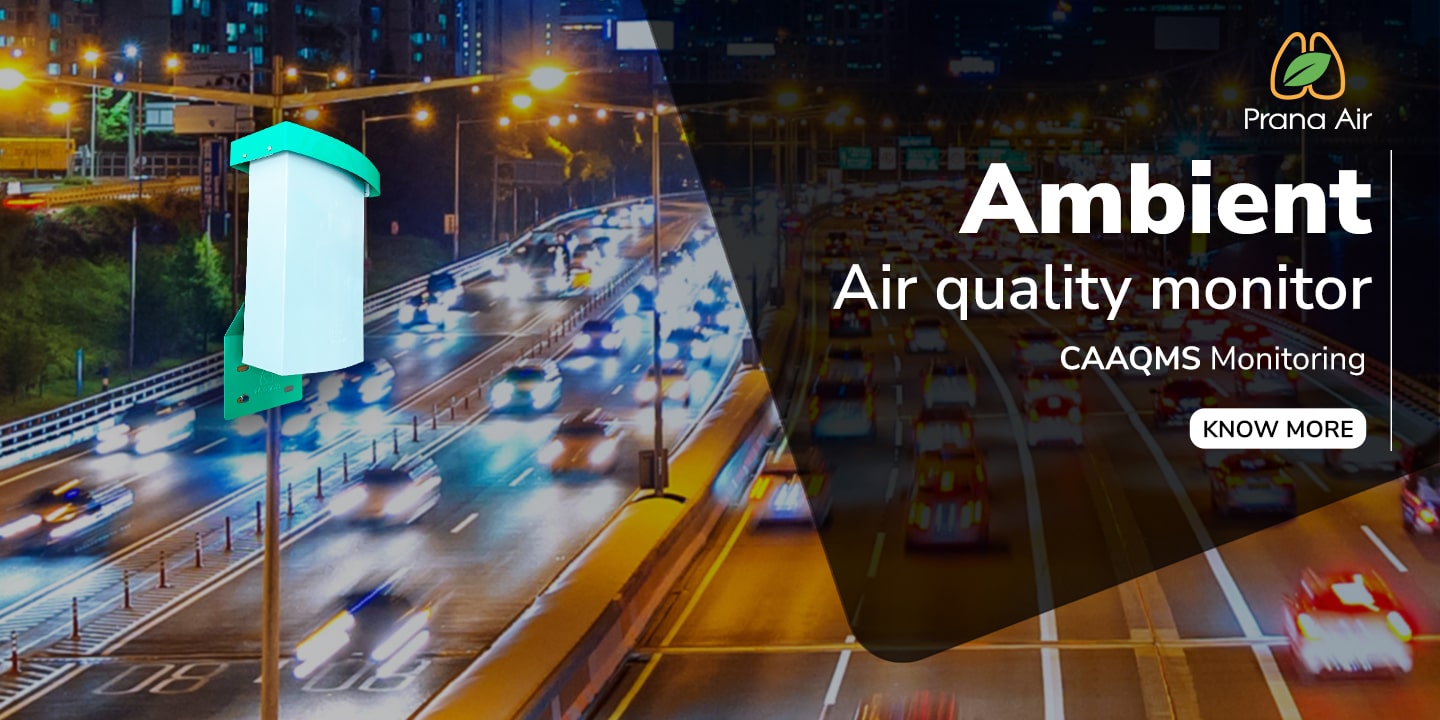
METRO CITIES OF REAL-TIME AIR QUALITY INDEX (AQI)
Explore the real-time air quality - PM2.5, PM10, CO, Ozone, SO2 & NO2 data from AQI ambient air quality monitors
Air Quality Index Scale
Know about the category of air quality index (AQI) your ambient air falls in and what it implies.
Good
0-50
Moderate
51-100
Poor
101-200
Unhealthy
201-300
Severe
301-400

Hazardous
401-500+
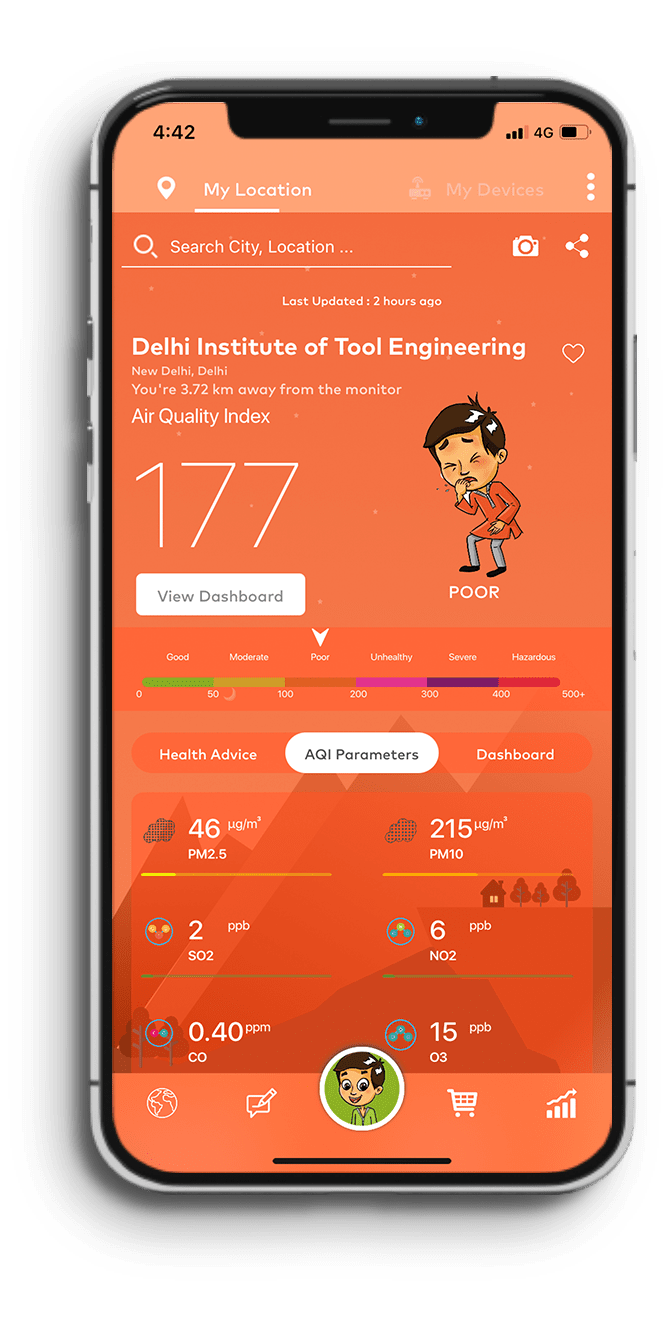
AQI Air Quality App
Free AQI Mobile App For Your IOS, Android, And Smart TV Devices

Real-time air quality API for accurate global data
World air pollution map and weather map
Insightful Air quality monitoring dashboard


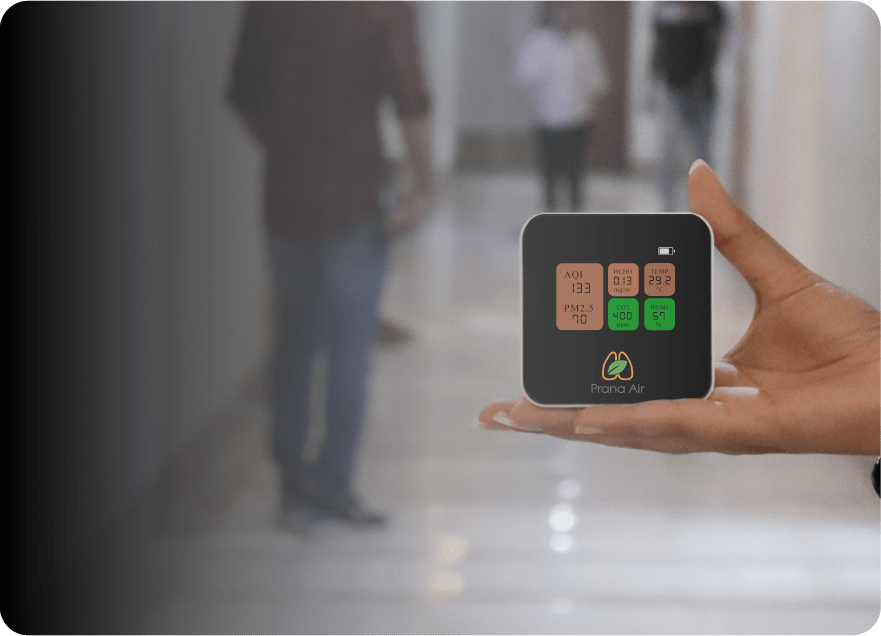
Know What You Breathe
Prana Air and AQI are one-stop solution providers for indoor and outdoor air quality problems.
Protecting our health and well-being from air pollution.


Recent Blogs
Here Are Some Resources That You Can Go Through To Find Out More About Air Quality & Pollution.


El Niño Effects on Earth 2024:


Media Coverage
Air Quality Around the world
Real-time air quality and weather data around the world